
總覽
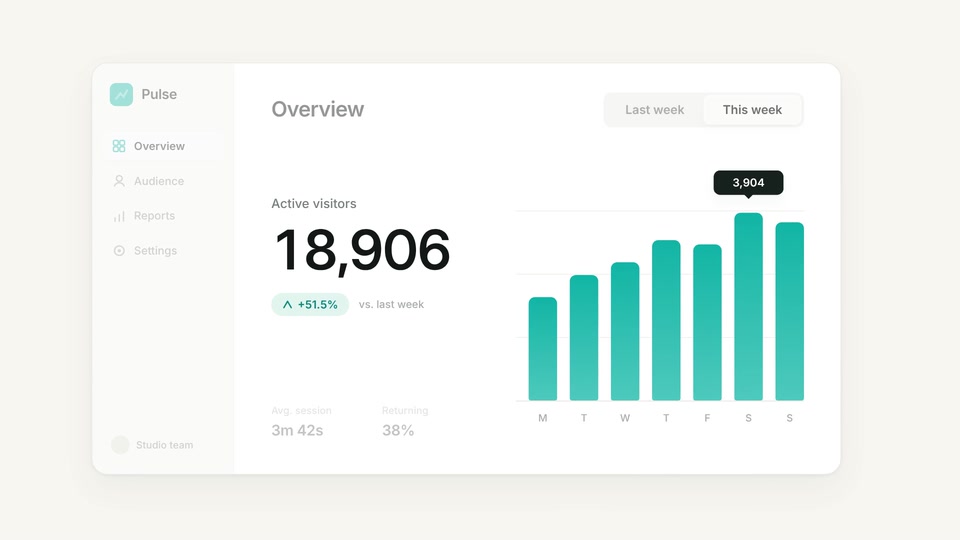
以虛構數據儀表板示範單一篩選操作。期間選項滑至「本週」,訪客數從 12,480 上升至 18,906,長條圖依序成長,側邊欄與頁首則淡化,凸顯結果。
動態解析
- 0–1.9s
1. 選擇期間
游標沿弧線移入,停在「本週」後點擊。選項底色以輕柔彈性滑動。
- 1.9–4.1s
2. 呈現變化
等寬數字遞增,長條由左至右成長,+51.5% 標籤出現;畫面微微推近,次要介面逐漸淡出。
- 4.1–8s
3. 停留與重置
結果停留約三秒,接著數字回復、長條下降,焦點退回第一個影格。
開啟場景
下載並解壓縮專案,再以已安裝的 Mografy CLI 開啟。
下載場景專案mografy dev ./analytics-product在 Mografy 原始碼儲存庫中,同一個專案位於 examples/analytics-product。動畫程式碼放在 scenes/main.ts ,輔助函式位於 scenes/kit.ts。ZIP 內含 Inter 字型檔與授權文件。
原始提示詞
閱讀創作需求
Create an 8-second motion design demo that explains a fictional analytics product through one clear interaction. Use a warm-white background, dark typography, subtle gray surfaces, and teal #12B5A5 accents. Keep the composition spacious, polished, and readable at thumbnail size. Begin with a minimal dashboard containing a sidebar, one metric, and a small bar chart. A cursor selects “This week.” The metric counts up and the chart smoothly updates. Gently focus the composition on the changed result while secondary UI becomes quieter. Use restrained movement, coordinated timing, and smooth easing. Hold the completed state for the final 2 seconds. Design a clean transition back to the beginning. Avoid dense dashboard details, excessive text, decorative particles, and dramatic camera movement. Do not include video controls, website card labels, or audio.