
Overview
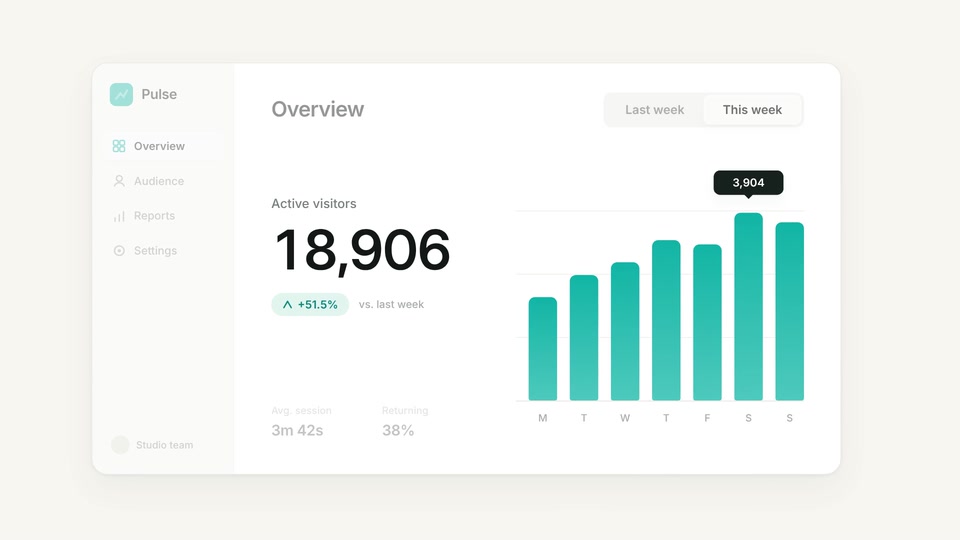
A fictional analytics dashboard demonstrates a single filter change. The selected period slides to This week, the visitor count rises from 12,480 to 18,906, and the bars grow in a short stagger while the sidebar and header quiet down around the result.
Motion breakdown
- 0–1.9s
1. Choose the period
The cursor arcs in, rests on This week, and clicks. The segment highlight slides across with a soft spring.
- 1.9–4.1s
2. Show the change
The count rises with tabular figures, bars grow left to right, a +51.5% chip appears, and the view eases in slightly as secondary UI fades back.
- 4.1–8s
3. Hold and reset
The result holds for about three seconds, then the number rolls back, the bars settle, and the focus releases into the first frame.
Open the scene
Download and unzip the project, then open it with your installed Mografy CLI.
Download scene projectmografy dev ./analytics-productIn the Mografy source repository, the same project lives at examples/analytics-product. Animation code stays in scenes/main.ts with its helpers in scenes/kit.ts. The ZIP includes the Inter font files and license.
Original prompt
Read the creative brief
Create an 8-second motion design demo that explains a fictional analytics product through one clear interaction. Use a warm-white background, dark typography, subtle gray surfaces, and teal #12B5A5 accents. Keep the composition spacious, polished, and readable at thumbnail size. Begin with a minimal dashboard containing a sidebar, one metric, and a small bar chart. A cursor selects “This week.” The metric counts up and the chart smoothly updates. Gently focus the composition on the changed result while secondary UI becomes quieter. Use restrained movement, coordinated timing, and smooth easing. Hold the completed state for the final 2 seconds. Design a clean transition back to the beginning. Avoid dense dashboard details, excessive text, decorative particles, and dramatic camera movement. Do not include video controls, website card labels, or audio.